
Measuring database CI/CD pipeline performance (database observability)
June 26, 2024

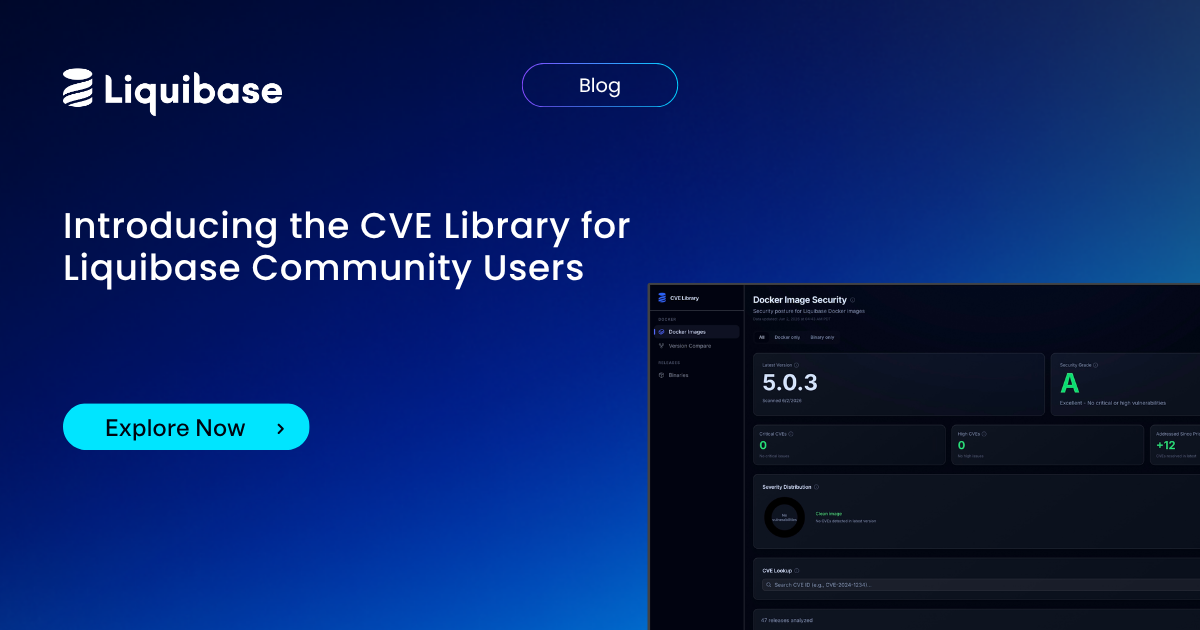
See Liquibase in Action
Accelerate database changes, reduce failures, and enforce governance across your pipelines.

This is one section of our complete 12-part guide to CI/CD for databases - get your copy.
Once you have your pipeline and the ability to measure its behavior, the work of maintaining it and – in true DevOps spirit – continuously improving it begins.
Visibility into the health and performance of your database CI/CD pipeline begins by tapping log data from pipeline activity to feed DevOps dashboards with metrics on change management and workflow performance. Available metrics are a matter of technical capability – what is being logged – and team/DevOps priorities. Both of which will evolve over time.
To begin, however, think about basic change operation monitoring metrics like:
- Deployment count
- Application count
- Database endpoint count
- Teams using the automated pipeline
Database pipeline analytics measures workflow performance across the database change management process. By evaluating these metrics, teams can gain insights into the efficiency and effectiveness of their database change pipelines, identifying areas for improvement and driving toward optimal performance.
Fortunately, we can look to DORA – the DevOps Research and Assessment – for the definitive high-level metrics for DevOps activities and CI/CD pipelines.
DORA metrics for database change management
Beyond the simple “beginner” metrics above, DORA’s four core metrics – typically applied to application development pipelines – can be extended to database CI/CD workflows to serve as a foundational pipeline analytics structure.
- Deployment frequency
- How often an organization successfully releases to production
- Lead time for changes
- The amount of time it takes a commit to get into production
- Change failure rate
- The percentage of deployments causing a failure in production
- Time to restore service
- How long it takes an organization to recover from a failure in production
The DORA metrics are ‘outcome’ metrics that generally deal with the final result of a change flowing through the pipeline. They are not ‘operational’ metrics — things that you measure to affect these outcomes. It is difficult to be prescriptive or specific for operational metrics as technology choices, application architecture, and business situations can affect which ones will be most influential on outcomes for any given team. Still, examples could include:
- Average age of Sub-Prod environment (between refreshes)
- Time required to refresh a Sub-Prod database
- Deployment failure rate per Sub-Prod database
- Deployment frequency per Sub-Prod database
- Change failure rate per Sub-Prod database
- Maintenance intervention rate for all databases
- % Changes/Batches delivered without DBA review/intervention
- Database batch failure rate at CI level
- % Changes/Batches delivered without revision after CI level
The DORA metrics and similar technical metrics often serve as a good starting point for database pipeline observability. Over time, as the team learns and improves the pipeline, the overall set of items tracked is usually expanded or refined.
The team should begin asking itself more specific business-type questions and using the data it is collecting to solve. This provides a means of showing value to the organization overall and also serves to identify which data is – or is not – useful to the organization overall. Examples of these kind of questions include:
- Why does it cost more to deploy database A than database B?
- Why does database team C deploy 5 times faster than teams A and B? (And how can we level up A and B?)
- How do changes in the database schema affect application performance?
- What is the frequency and impact of database rollbacks on production stability?
- How does the change failure rate for database updates compare across different environments or teams?
- What database(s) are drifting from the norm or from what is expected?
- What users/system users have been added to have access to the database?
Database pipeline considerations
Are there really are any special considerations necessary for the database portion of the delivery pipeline? If you have a functioning CI/CD pipeline for database changes, why wouldn’t you use the same metrics? The answer is, of course, that you should absolutely use the same metrics; you just have to think about what they mean for your pipeline and your situation. Let’s review the core four DORA metrics and examine what each of them means in the context of our CI/CD pipeline concept.
Delivery Lead Time
Delivery Lead Time represents a simple flow metric that could be applied to nearly anything. It examines the average elapsed time between the time a change is defined to when it is delivered into the production environment. With a CI/CD pipeline and automation, we know when a change was added to the pipeline and included in a batch. Either of those two points represent a logical ‘start’ point with the endpoint being when the batch is completely executed into the production environment. The start points you choose should correspond with the one chosen by the rest of the pieces of the application stack.
Databases have a flow of changes that may move independently of business functionality changes. Consider a simple maintenance change, such as adding an index to a column. he time it takes the database team to respond to tuning changes is an important factor and should be part of the database-specific use of this metric. It’ll also be important to ensure that stakeholders understand whether these events are included in rollup data going toward the full stac’ metrics.
Deployment Frequency
Deployment frequency measures the number of times you deploy database changes into production in a given timeframe. The only variation on the theme between DevOps teams and database teams here is once again related to maintenance tasks. The database team needs to know the aggregate and maintenance metrics. For example, a high ratio of maintenance changes relative to changes associated with an application change may be an indication of a deeper issue. As with Delivery Lead Time, stakeholders should be aware of how this rolls up to the rest of the full stack metrics.
Change Fail Rate
Change Fail Rate is the number of times a change does not work the first time when deployed to production. Leveraging Change Fail Rate for database observability is again based on maintenance and tuning changes.
For example, it would seem obvious that a tuning change did not run when applied changes would count, though what about tuning changes that run successfully and have no measurable effects? Would that be considered a failure? This is another area that needs alignment between the database team and other relevant stakeholders. The broader set of stakeholders, for example, may not find non-event changes relevant, while these may be important to the database team. Such a variation in perception between the database team and the broader set of stakeholders must be carefully managed for both the health of the databases and the health of the team’s dynamics.
Mean Time to Restore Service
Mean Time to Restore Service, or MTTR, measures the average time to recover from a failed deployment, incident, or outage.It also brings some decisions when it is applied to a specific piece of the technology stack, such as the database. This metric, unlike the other three, does not easily apply to just one area. For example, there can never be a situation where the database can be compromised without comprimising the application(s).As a result, it is unlikely that this metric will have a database-specific implementation.
Additional database CI/CD metrics
There are a lot of things that can be measured in a database CI/CD pipeline and there are plenty of opportunities to expand the list. To avoid having too many, stay focused on the ones that directly benefit you and your team.
Begin by setting a strategy – perhaps some simple decision criteria questions. For example:
- What do you need to know to safeguard and improve the workflow?
- Which measurements are you capable of collecting?
Those two questions alone might be enough to define your entire measurement strategy.
Once you have decided how you want to determine if individual database DevOps metrics are beneficial, you should focus on instrumenting specific topic areas. It’s better to focus your efforts to add metrics one topic at a time. This enables you to get to value in the data more quickly. Some example focus areas might be:
- DevSecOps
- Database Performance
- Regulatory compliance-related errors
- Rollbacks
- Success/failure rate
- Critical and high policy violation count
- Backup and recovery times
- Data growth rate
- Audit log volume
To illustrate the concept of metrics within topic areas, we can look at a pair of examples. A Security team may have an initiative to improve the overall security posture of an application system – including its database. So, you might institute some DevSecOps metrics such as:
DevSecOps metrics
- Vulnerability discovery time
- Time to remediate vulnerabilities
- Open security issue count
- Frequency of security scan
- Incident response time
- Mean time to recovery for security incidents
- Failed security builds
- High-risk vulnerabilities outstanding
- Automated security test coverage (%)
Another example might be a need from the database team to gain better insight into database health via:
Database performance metrics
- Query response time
- Database connection times
- CPU utilization
- Memory usage
- Disk I/O throughput
- Query errors
- Connection errors
- Transaction throughput
- End-user latency
While these examples are by no means comprehensive, they can get you thinking about what is most effective for your team.
Using metrics well requires a bit of art to go with the science and math. While there are no true ‘one size fits all’ metrics when talking about delivering changes to an application system, the DORA metrics are close and are backed by very rigorous and documented research. The task for the database CI/CD pipeline owner is to adopt them and to determine what operational metrics will help their team drive the desired outcomes.
Ready to dive into all 12 parts of the complete CI/CD for databases guide? It covers:
- The goals & challenges of designing CI/CD pipelines
- Batching database changes
- Automating database “builds”
- Ensuring quality database changes
- Reliable and predictable database deployments
- Trustworthy database environments
- Sandbox databases
- Database governance for consistency, quality, and security
- Observability for database CI/CD
- Measuring database CI/CD pipeline performance
- Handling and avoiding problems with database changes
- Bring CI/CD to the database with Liquibase
.png)
Continue reading
.png)
.png)


